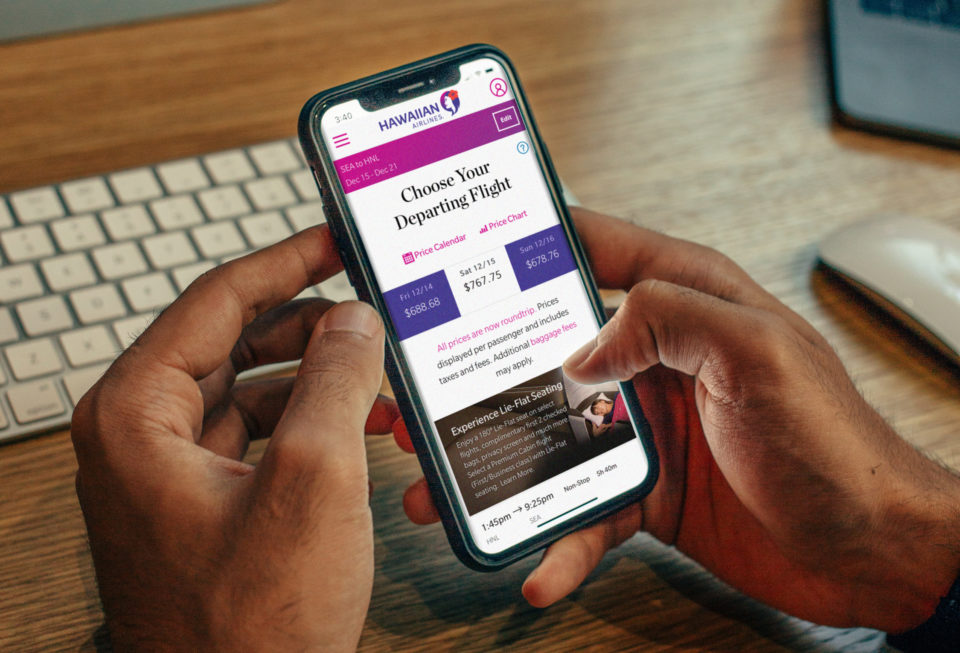
Hawaiian Airlines prides themselves on high-quality service. With a commitment to world-class travel and hospitality, their vision is to be the “#1 destination carrier in the world.” As use of mobile technology increases, so does use of airline applications. According to a Helpshift survey, 83% of American airline app users have stated they feel airline apps improve the travel experience. Our goal was to investigate whether the Hawaiian Airlines mobile app lives up to the company’s high standard of quality by evaluating the interface of the application and uncovering challenges customers may experience during the process of booking a flight. UX Researcher & Project Manager Sep – Nov 2018 • 4 Team Members
Overview
Role & Duration
Areas of Focus: User Research, Visual Design
The Hawaiian Airlines mobile app has one of the lowest ratings of all airlines—at 1.5 out of 5 stars—according to the Apple App Store. The many one-star reviews highlight a wide variety of current usability issues that have failed to be updated in months or even years.
These usability issues are directly contributing to low mobile adoption, low retention rates and decreased customer satisfaction. Since their main competitor, Southwest Airlines, announced they will be introducing direct flights to Hawaii, it is now more crucial then ever to address these issues so Hawaiian Airlines can remain competitive.
To gain more understanding of the company, users, and product scope, the team gathered information by analyzing other airline mobile apps, reading user feedback available online, and conducting an expert evaluation.

The Hawaiian Airlines mobile app provides two functions to its users: (1) Find and book a flight; and (2) View and email their itinerary. The team determined the scope of our usability testing would include the first function.
The objectives for this study included:
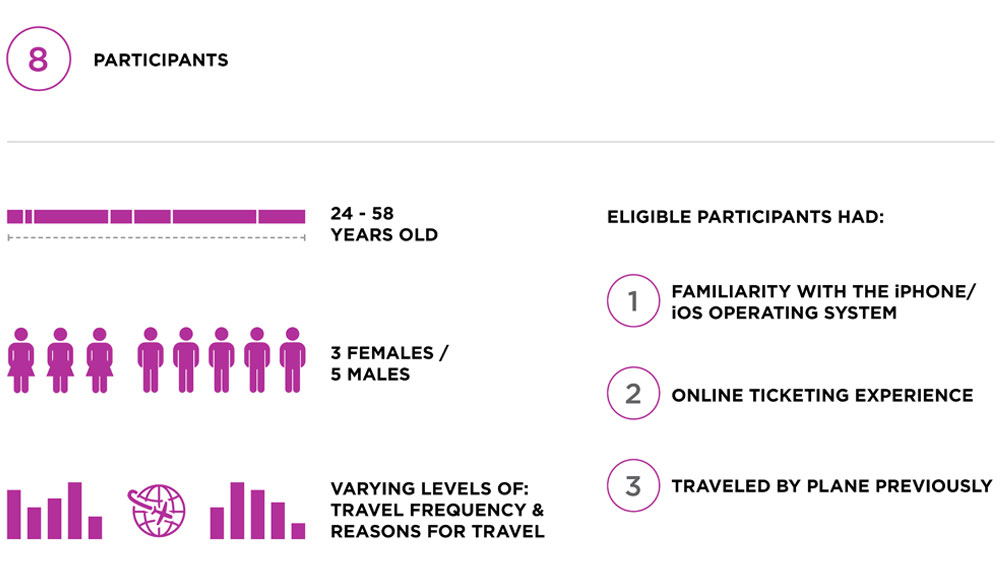
Each of the participants were invited to a 30-minute long in-person one-on-one session (i.e. participant and moderator). Each session consisted of:
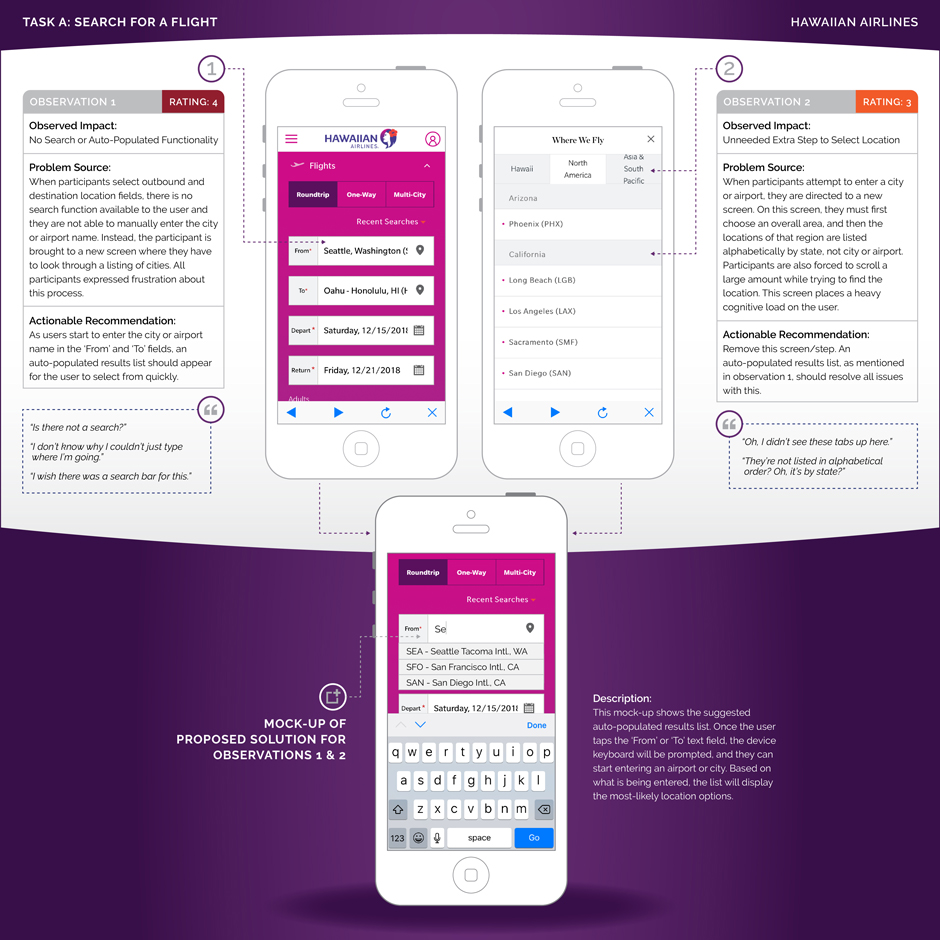
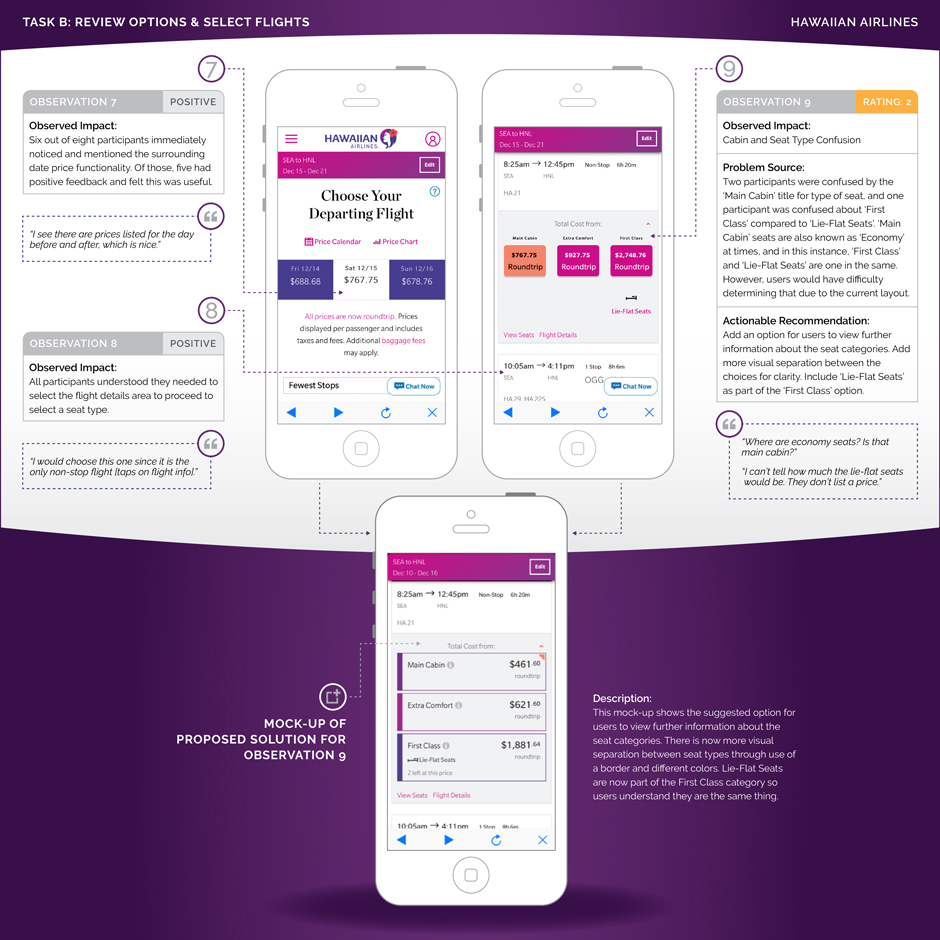
After conducting the usability test, we compiled and analyzed findings for each participant and organized them by task screen. For each observed issue, details were summarized and included:
Positive findings were also noted. Each observed impact was then assigned a severity rating based on a 0-to-4 scale, in which ‘0’ means it may not be a usability problem at all, and ‘4’ means it is a usability catastrophe.
All findings were presented in a report similar to the examples below:
From a business perspective, our goal was to provide Hawaiian Airlines with valuable insight into what their customers feel their mobile experience is lacking, how this may be adversely impacting the business, and what they could do to improve customer satisfaction.
We suggest that by addressing the issues detailed below, Hawaiian Airlines can lower their risk of decreased user activity and prevent loss of their customer base.
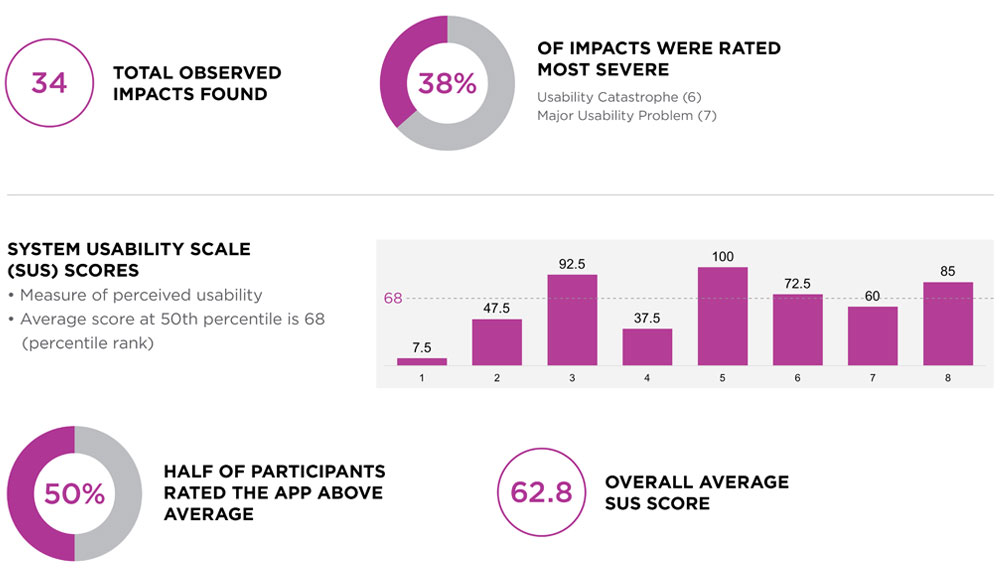
During this usability study, a total of 34 observed impacts were found and 38% of all observations were either a usability catastrophe or a major usability problem, and should be addressed immediately. These issues were observed throughout the task scope. All other observed impacts were considered to be minor usability or cosmetic problems.
Using a 10-item questionnaire, we also measured participants’ perceptions of the usability of the Hawaiian Airlines mobile application. Only 50% of participants rated the app usability above average and the overall average SUS score was 62.8—which is considered below average.
Only two out of eight participants had heard of Hawaiian Airlines previously. If the company would like to continue their current growth, brand visibility and awareness need improvement.
The overall visual look of the mobile app received mostly positive feedback, however the dated functionality and slowness of the app received the most criticism.
Three out of eight participants mentioned there was too much scrolling needed on each screen and there was a large amount of unnecessary information.
.
.
Email me or fill out the contact form linked below.
Contact Me